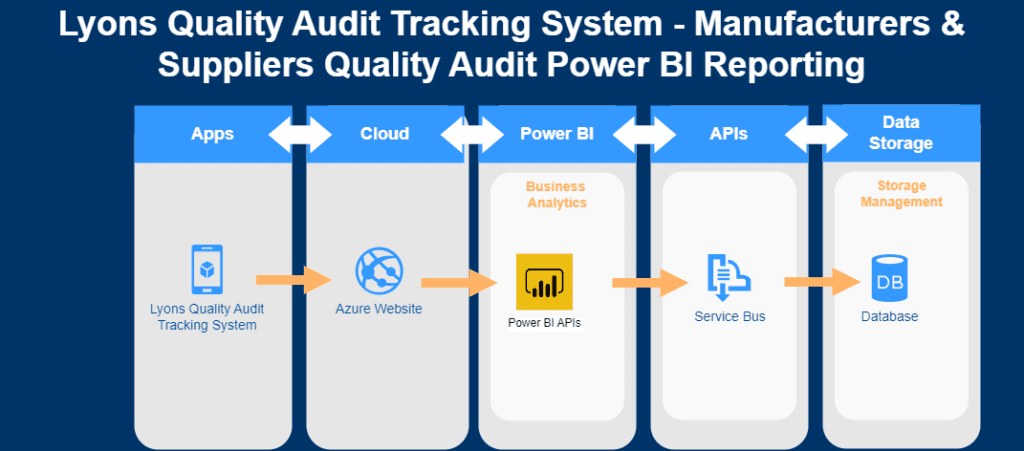
LQATS embeds Microsoft Power BI reports — Bring all business intelligence data.
Effortlessly embed Microsoft Power BI reports and dashboards in LQATS.
Embed blended datasets — Blend data from several sources and embed the Power BI reports in LQATS. Power BI Supply Chain Audit Analytics is a powerful tool for visualizing and analyzing supply chain performance, compliance, and operational efficiency. It enables organizations to identify bottlenecks, reduce risks, and enhance decision-making by transforming raw data into actionable insights.
Using analytics for supply chain management is a powerful way to improve visibility, decision-making, and efficiency across the supply chain. Power BI helps consolidate, analyze, and visualize data from multiple sources, enabling you to monitor and optimize supply chain performance in real time.
Measure, monitor, and manage your supply chain performance to ensure strong operating results.
A Full View of Your Supply Chain Audits. It’s never been easier to see audit for purchase and sales orders so you can avoid costly interruptions due to sourcing quality.
LQATS with Power BI is used to analyze supplier quality by measuring defects. This is broken down to different timeframes and categories such as defect type, vendor, facility, or material.
Key Features of Power BI for LQATS Supply Chain Audit Analytics
1. Data Integration and Connectivity
- Connect to multiple data sources (ERP systems SAP, LQATS databases).
- Consolidate data from logistics, inventory, and supplier systems.
2. Dashboards and Visualizations
- Supplier Performance Monitoring: Measure metrics such as defect rates, and compliance with agreements.
- Risk Management: Identify and flag areas with high operational or compliance risks.
3. Advanced Analytics
- Root Cause Analysis: Drill down into anomalies or inefficiencies in the supply chain.
- Trend Analysis: Track key performance indicators (KPIs) over time to spot patterns.
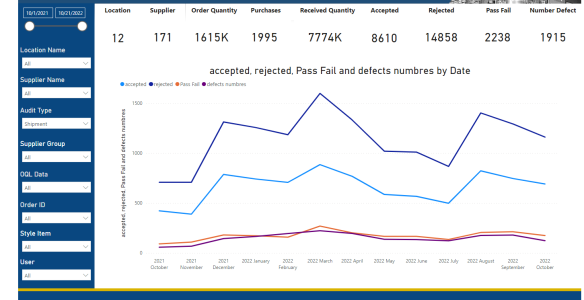
Audits by Date
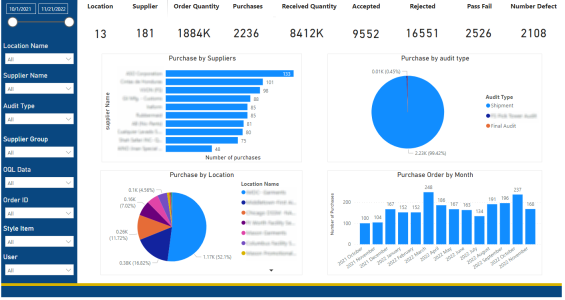
Purchase Audit by Supplier, Location and Month
Supplier OQL & Style Audit by auditors
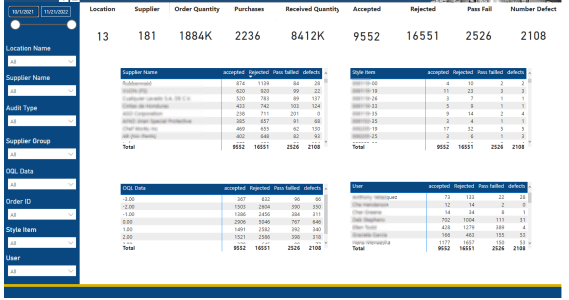
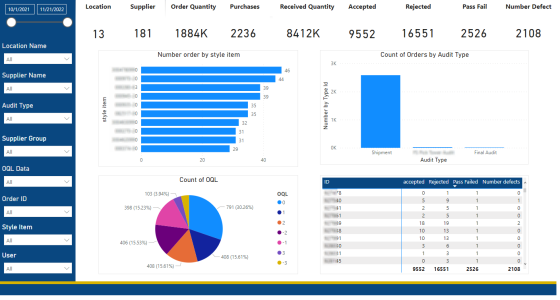
Style Audit with OQL
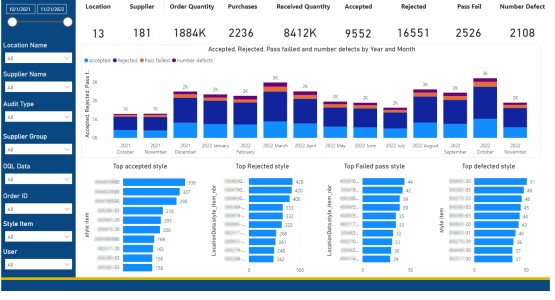
Audit by Month, Top Accepted, rejected, failed and defected styles
