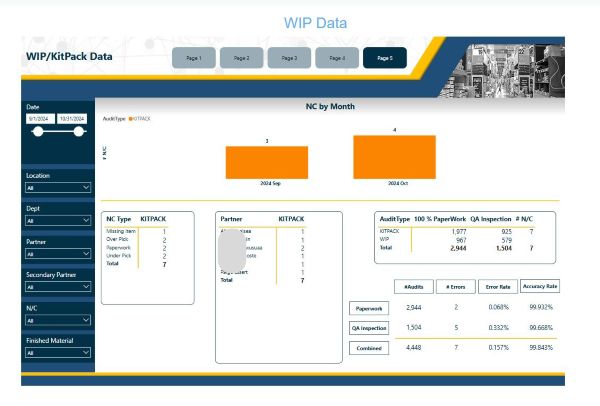
LQATS Work in Progress (WIP) and Kitpack Nonconformance Report
Work in Progress (WIP)
Work in Progress (WIP) Report is a business management tool that tracks the current status of unfinished goods or tasks within a production or operational process. It provides insights into items that are in various stages of completion but not yet finished or delivered.
Kitpack Nonconformance
Kitpack Nonconformance refers to a quality management issue where a kitpack (a collection of parts, components, or materials assembled for a specific production or maintenance task) fails to meet predefined standards or specifications. This nonconformance could be due to missing, incorrect, damaged, or defective items within the kitpack.
Work in Progress (WIP) and Kitpack Nonconformance Report using LQATS and Power BI, you can follow these key steps:
1. Data Preparation
- WIP and Kitpack Data Sources: LQATS ensures tracking production and inventory.
- Nonconformance Data: Identify fields relevant to nonconformance, such as defect type, quantity, cause, responsible department, and corrective actions taken.

2. Define KPIs and Metrics
Identify the key performance indicators (KPIs) and metrics to display in Work in Progress (WIP) and Kitpack Nonconformance Report. Common ones include:
- Nonconformance Rate: Percentage of nonconforming items against total production.
- Nonconformance by Type: Breakdown of nonconformance by category (e.g., material, process).
- Time to Resolution: Average time taken to resolve nonconformance issues.
- WIP Nonconformance: Count or percentage of WIP items marked as nonconforming.
- Kitpack Accuracy: Accuracy of kitpacks in terms of component matching and completeness.
3. Build Report Visuals
In Power BI, use visuals to help understand and track nonconformance for Work in Progress (WIP) and Kitpack Nonconformance Report. Examples:
- Nonconformance Summary Card: Single-number KPIs for total nonconformance, WIP nonconformance rate, and Kitpack accuracy.
- Trends Over Time: Line or bar charts showing nonconformance trends (e.g., per month or per week).
- Pareto Chart: Display the most frequent nonconformance types, aiding in identifying root causes.
- Departmental Analysis: Show nonconformance rates by department or team responsible, to pinpoint areas needing focus.
- Detailed Table: Include a table listing specific nonconformance records with filters for detailed analysis.
4. Data Interactivity and Filtering
- Filters: Set up slicers to allow users to filter by date, department, defect type, or resolution status.
- Drill-throughs: Add drill-throughs on visuals to enable detailed analysis from summary data. For example, drill into a nonconformance type to see individual cases.
5. Conditional Formatting and Alerts
- Use conditional formatting on visuals to highlight high nonconformance rates (e.g., red for above threshold rates).
6. Work in Progress (WIP) and Kitpack Nonconformance Report Customization and Publishing
- Add a clear title and report description to guide users.
- Publish the report to the Power BI Service, setting up sharing and permissions to ensure the right stakeholders have access.
- Schedule data refreshes to keep the report updated with the latest data, based on the frequency of data updates.
By following these steps, LQATS WIP and Kitpack Nonconformance Report provides real-time insights, allowing you to track, analyze, and manage nonconformance effectively.